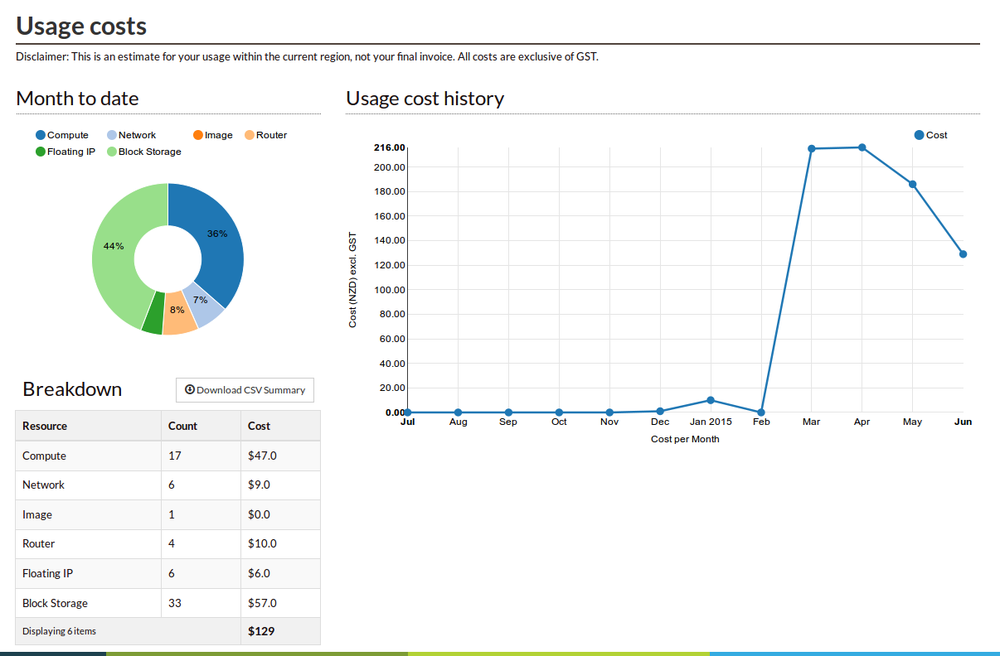
When infrastructure and IT becomes this easy, keeping an eye on your running costs is important. To help you do a great job of managing your budget, we've introduced a new usage tracking dashboard page.
The usage costs report shows you an estimate for your usage within the current region. It provides a breakdown per service, so you can quickly spot which services you are using the most and where your savings opportunities are. It also shows you the aggregate cost per month over the last twelve months, so you can identify usage patterns and project the expected usage for the current month.